40 Essential Candlestick Patterns Every Trader Should Know
Candlestick patterns are at the heart of technical analysis. Developed centuries ago in Japan, they are visual representations of price movements that help traders interpret market sentiment and predict future price action. Every candlestick tells a story — about buying pressure, selling pressure, indecision, or reversal. Understanding candlestick patterns is essential for any serious trader who wants to improve timing, reduce risk, and increase the accuracy of trade setups.
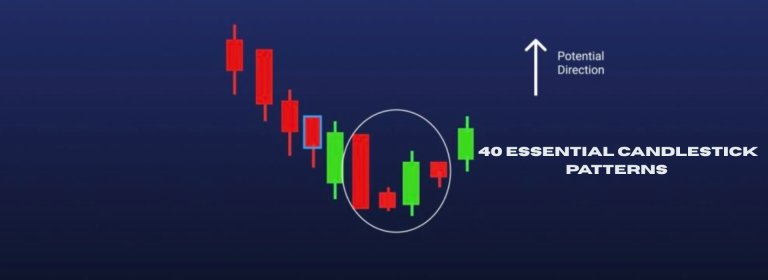
In this blog, we present 40 powerful candlestick patterns every trader should know, categorized into bullish, bearish, and neutral/continuation setups — along with their meanings and typical trading implications.
What is a Candlestick?
A candlestick is made up of four key price levels:
- Open: The price at which the candle started
- High: The highest price during the time period
- Low: The lowest price during the time period
- Close: The price at which the candle ended
The shape and position of the body and wicks (shadows) give insight into market psychology and potential turning points.
I. Bullish Reversal Candlestick Patterns
These patterns suggest a possible reversal from a downtrend to an uptrend. They are best used with confirmation and in support zones.
1. Hammer
A single candle with a small body at the top and a long lower wick. Indicates strong buying after early selling.
2. Bullish Engulfing
A two-candle pattern where a large green candle fully engulfs the previous small red candle. Sign of reversal strength.
3. Piercing Line
A bullish candle that opens lower but closes above the mid-point of the previous red candle. Strong reversal signal.
4. Morning Star
A three-candle pattern (red candle, small-bodied candle, green candle). Suggests exhaustion of sellers and potential rally.
5. Inverted Hammer
Occurs at the bottom of a downtrend. Small body with a long upper wick — shows buying interest after initial selling.
6. Three White Soldiers
Three long green candles with higher closes. Signals strong reversal and buying momentum.
7. Bullish Harami
A small green candle contained within the previous red candle. Indicates indecision and potential trend reversal.
8. Dragonfly Doji
A doji with a long lower wick and no upper wick. Shows rejection of lower prices and potential for a bullish reversal.
9. Tweezer Bottom
Two candles with similar lows. Indicates strong support and a likely trend reversal.
10. Marubozu (Green)
A long green candle with no wicks. Indicates strong bullish sentiment and continuation after breakout.
II. Bearish Reversal Candlestick Patterns
These patterns suggest a change from an uptrend to a downtrend. Watch for these at resistance zones or after extended rallies.
11. Shooting Star
A single candle with a small body and long upper wick. Shows failure to sustain higher prices and potential reversal.
12. Bearish Engulfing
A large red candle that completely engulfs the previous green candle. Strong reversal signal.
13. Dark Cloud Cover
A bearish candle opens above but closes below the mid-point of the previous green candle. Indicates potential weakness.
14. Evening Star
A three-candle pattern (green, small-bodied candle, red candle). Signals the end of bullish momentum.
15. Hanging Man
Occurs at the top of an uptrend. A candle with a small body and long lower wick. Warns of potential reversal.
16. Three Black Crows
Three consecutive long red candles. Indicates strong bearish pressure and likely trend reversal.
17. Bearish Harami
A small red candle within the previous green candle’s body. Signals potential exhaustion of buyers.
18. Gravestone Doji
A doji with a long upper wick and little or no body. Signals rejection of higher prices.
19. Tweezer Top
Two candles with similar highs. Indicates a strong resistance level and potential trend reversal.
20. Marubozu (Red)
A long red candle with no wicks. Indicates intense selling pressure.
III. Continuation & Indecision Candlestick Patterns
These patterns suggest market indecision or the continuation of an existing trend. Always confirm with volume and trend analysis.
21. Doji
Open and close are nearly the same. Represents indecision. May lead to reversal if followed by confirmation.
22. Spinning Top
Small body with upper and lower wicks. Shows a balance of buying and selling pressure.
23. Inside Bar
The candle is completely within the high and low of the previous candle. Indicates consolidation.
24. Outside Bar
The candle fully engulfs the previous candle’s range. Can signal trend continuation or reversal depending on the direction.
25. Rising Three Methods
A bullish continuation pattern with one long green candle, followed by small bearish candles, and then another green candle.
26. Falling Three Methods
Bearish continuation with a red candle, small green candles, then another red candle. Confirms ongoing downtrend.
27. High Wave Candle
Long upper and lower shadows with a small real body. Shows confusion or high volatility.
28. Mat Hold Pattern
A bullish continuation pattern with a strong uptrend, small pullback, then another surge upward.
29. Separating Lines (Bullish/Bearish)
Two candles of the same color that open at the same level — confirms the direction of the trend.
30. Upside Gap Two Crows
A bearish pattern where two small red candles follow a green one with gaps. Often found at market tops.
IV. Advanced or Less Common but Powerful Patterns
31. Three Inside Up
A bullish harami followed by a third green candle. Strong reversal indicator.
32. Three Inside Down
A bearish harami followed by a third red candle. Indicates selling momentum.
33. Kicker Pattern
A sharp change in direction marked by a strong candle gapping away from the previous candle.
34. Counterattack Lines
Two opposite candles where the second candle opens opposite and closes at the same level as the first.
35. Long-Legged Doji
Extreme wicks on both sides. Often seen before a large breakout or reversal.
36. Window (Gap)
Not a candle by itself but a gap between candles. Gaps can act as support or resistance.
37. Homma’s Umbrella (Karakasa)
Another name for the hammer/inverted hammer used in Japanese candlestick lore.
38. Belt Hold (Bullish/Bearish)
A long body with no lower (bullish) or upper (bearish) shadow. Indicates trend continuation.
39. On-Neck Line
A bearish continuation pattern where a red candle is followed by a small green candle closing near its low.
40. Breakaway Pattern
A five-candle reversal pattern showing a shift from one trend to another.
How to Use Candlestick Patterns Effectively
- Always Use Context
Candlesticks should not be used in isolation. Always consider the overall trend, support/resistance zones, and volume.
- Combine with Technical Tools
Pair candlestick signals with moving averages, RSI, MACD, or Bollinger Bands to confirm the setup.
- Look for Confirmation
Avoid taking trades based on a single candle. Wait for a follow-up candle to confirm the trend. - Use on Appropriate Timeframes
Candlestick analysis works best on daily and hourly charts but can also be effective on 15-minute charts for intraday traders
Learn Candlestick Patterns at Capital Varsity
At Capital Varsity, we offer specialized training in Technical Analysis, where you can learn all major candlestick patterns, chart setups, and price action strategies used by professional traders. Our approach focuses on practical application in live markets, so students not only understand theory but also learn to read market psychology through candles.
Our technical analysis course includes:
- Visual identification of candlestick patterns
- Trade setup formation using candles
- Trend confirmation techniques
- Risk and stop-loss placement
- Live market observation and backtesting
Whether you’re a beginner or an experienced trader, mastering candlestick patterns is a must to level up your trading game.
Ready to Decode Market Movements?
Enroll now in our Technical Analysis & Stock Market Trading Course at Capital Varsity.
Location: E-72, 2nd Floor, South Extension Part-1, New Delhi
Call: +91 88514 95336
Website: india.capitalvarsity.comLet the candles light your way to confident trading.
- Visual identification of candlestick patterns