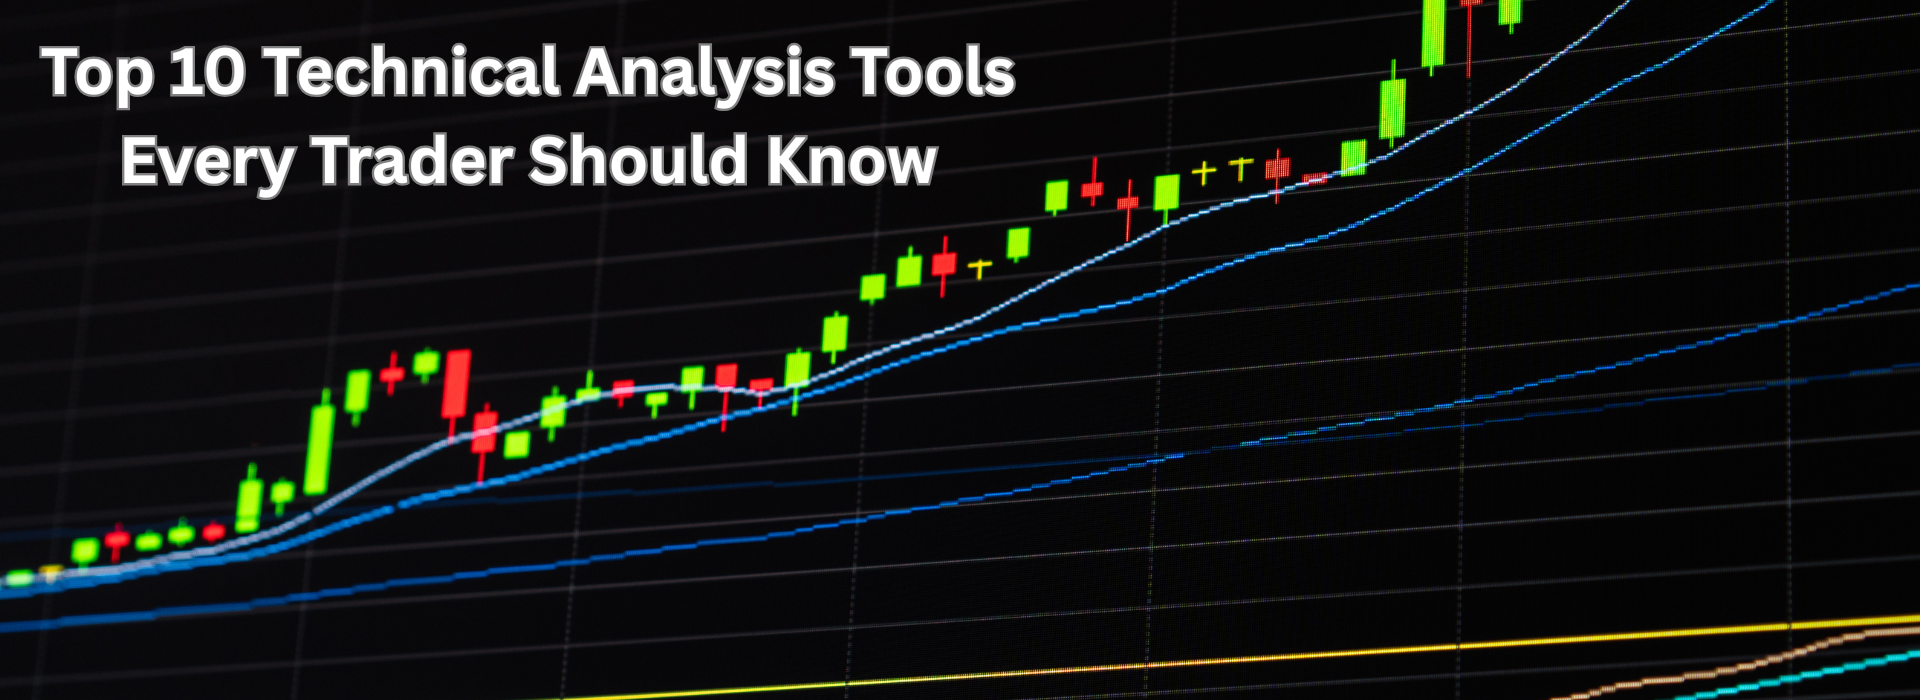
Top 10 Technical Analysis Tools Every Trader Should Know
Powered by Capital Varsity – South Delhi’s Leading Institute for Stock Market Education
Technical analysis is both a science and an art. It involves studying historical price and volume data to predict future market movements. Whether you’re a day trader, swing trader, or long-term investor, having the right tools is essential to making smart, profitable decisions.
At Capital Varsity, we teach our students how to master these tools through hands-on training, real-time market exposure, and expert-led sessions. Below, we share the top 10 technical analysis tools every trader should know to trade with more confidence and precision.
1. Moving Averages (MA)
Moving averages are widely used indicators that help smooth out price data by filtering market noise. The two key types are:
- Simple Moving Average (SMA): Calculates the average price over a specific time period.
- Exponential Moving Average (EMA): Gives more importance to recent prices, making it more responsive.
How to Use:
- Look for crossovers between short- and long-term MAs to identify potential entry or exit points.
Use them to determine the overall trend direction (uptrend or downtrend).
2. Relative Strength Index (RSI)
RSI measures the speed and magnitude of price changes on a scale from 0 to 100.
How to Use:
- Above 70 indicates overbought conditions (possible reversal).
- Below 30 indicates oversold conditions (buying opportunity).
Watch for divergence between price and RSI for early trend reversal signals.
3. Bollinger Bands
These bands consist of a SMA with an upper and lower band based on standard deviation. They help identify market volatility and potential breakouts.
How to Use:
- Breakouts beyond the bands may indicate trend continuation.
- A squeeze (narrowing bands) often precedes a significant price movement.
4. MACD (Moving Average Convergence Divergence)
MACD is a momentum indicator that shows the relationship between two EMAs.
How to Use:
- MACD Crossovers with the signal line can indicate buying or selling opportunities.
Divergence between price and MACD can predict reversals.
5. Fibonacci Retracement Levels
These are horizontal lines based on the Fibonacci sequence that highlight key support and resistance levels (23.6%, 38.2%, 50%, 61.8%).
How to Use:
- Identify pullbacks during an ongoing trend.
- Spot potential reversal zones or continuation points.
6. Volume Indicators
Volume shows how many shares or contracts are traded during a specific period.
How to Use:
- Volume spikes confirm the strength of price movements.
- Use volume oscillators to identify momentum shifts.
7. Candlestick Patterns
Candlesticks visually display the open, high, low, and close of a security. Certain patterns are reliable indicators of market sentiment.
How to Use:
- Bullish Patterns: Hammer, Morning Star, Engulfing
- Bearish Patterns: Shooting Star, Evening Star, Dark Cloud Cover
Great for spotting potential reversals or continuations.
8. Ichimoku Cloud
A complete system for identifying trends, momentum, support, and resistance in one glance.
How to Use:
- Above the cloud = bullish; below = bearish
Watch for crossovers between the fast and slow lines for trade signals.
9. Support & Resistance Levels
These are historical price levels where a stock tends to stop or reverse direction.
How to Use:
- Monitor for breakouts above resistance (bullish) or below support (bearish).
- Use as entry/exit zones or for stop-loss placements.
10. Stochastic Oscillator
This momentum indicator compares a stock’s closing price to its price range over a period.
How to Use:
- Above 80 = Overbought
- Below 20 = Oversold
Crossovers between %K and %D lines signal buy/sell opportunities.
Conclusion: Learn, Analyze & Trade Smarter with Capital Varsity
Technical analysis is essential for anyone serious about trading. At Capital Varsity, our stock market programs teach you how to use these tools in real-time markets, combining theory with practice. From beginners to experienced traders, we help you master the art of technical trading.
Our hands-on approach includes:
- Live market sessions
- Chart analysis workshops
- Mentorship by market experts
- Certification in Technical & Fundamental Analysis
📍 Visit Us: E-72, 2nd Floor, South Extension Part-1, New Delhi
📞 Call Now: +91 88514 95336
🌐 Website: india.capitalvarsity.com
Master the market with confidence. Enroll today at Capital Varsity.
Where learning turns into earning.
